reading-notes
Read: 12 - Docs for the HTML
Charts are far better for displaying data visually than tables and have the added benefit that no one is ever going to press-gang them into use as a layout tool. They’re easier to look at and convey data quickly, but they’re not always easy to create.
A great way to get started with charts is with Chart.js, a JavaScript plugin that uses HTML5’s canvas element to draw the graph onto the page. It’s a well documented plugin that makes using all kinds of bar charts, line charts, pie charts and more, incredibly easy.
Setting up
<!DOCTYPE html>
<html lang="en">
<head>
<meta charset="utf-8" />
<title>Chart.js demo</title>
<script src='Chart.min.js'></script>
</head>
<body>
</body>
</html>
Drawing a line chart
<canvas id="buyers" width="600" height="400"></canvas><script>var buyers = document.getElementById('buyers').getContext('2d');new Chart(buyers).Line(buyerData);</script>var buyerData = {labels : ["January","February","March","April","May","June"],datasets : [{fillColor : "rgba(172,194,132,0.4)",strokeColor : "#ACC26D",pointColor : "#fff",- pointStrokeColor : “#9DB86D”,
- `data : [203,156,99,251,305,247] } } }
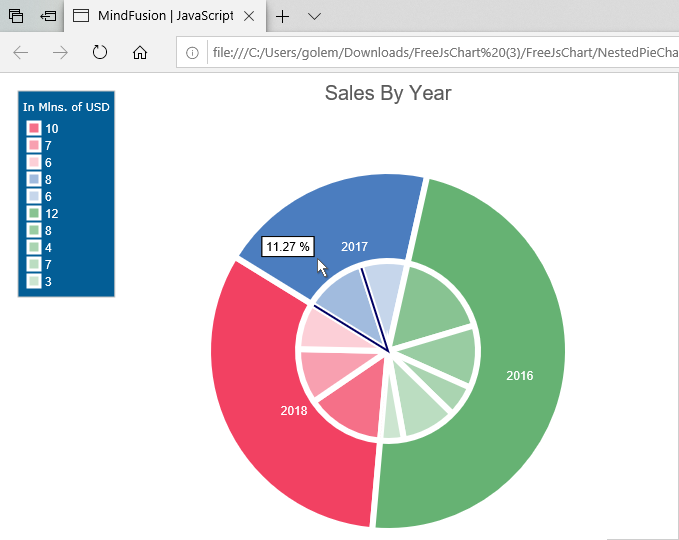
Drawing a pie chart
<canvas id="countries" width="600" height="400"></canvas>- var countries= document.getElementById(“countries”).getContext(“2d”);
- new Chart(countries).Pie(pieData, pieOptions);
- var pieData = [
- {
- value: 20,
- color:”#878BB6”
- },
- {
- value : 40,
- color : “#4ACAB4”
- },
- {
- value : 10,
- color : “#FF8153”
- },
- {
- value : 30,
- color : “#FFEA88”
- }
- ];
- var pieOptions = {
- segmentShowStroke : false,
- animateScale : true}
Drawing a bar chart
<canvas id="income" width="600" height="400"></canvas>- var income = document.getElementById(“income”).getContext(“2d”);
- new Chart(income).Bar(barData);
- var barData = {
- labels : [“January”,”February”,”March”,”April”,”May”,”June”],
- datasets : [
- {fillColor : “#48A497”,
- strokeColor : “#48A4D1”,
- data : [456,479,324,569,702,600]
- },
- {
- fillColor : “rgba(73,188,170,0.4)”,
- strokeColor : “rgba(72,174,209,0.4)”,
- data : [364,504,605,400,345,320]
- } ] }
The
<canvas id="tutorial" width="150" height="150"></canvas>
At first sight a <canvas> looks like the <img> element, with the only clear difference being that it doesn’t have the src and alt attributes. Indeed, the <canvas> element has only two attributes, width and height. These are both optional and can also be set using DOM properties. When no width and height attributes are specified, the canvas will initially be 300 pixels wide and 150 pixels high. The element can be sized arbitrarily by CSS, but during rendering the image is scaled to fit its layout size: if the CSS sizing doesn’t respect the ratio of the initial canvas, it will appear distorted.
Note: If your renderings seem distorted, try specifying your width and height attributes explicitly in the
<canvas>attributes, and not using CSS.
Drawing shapes with canvas
Drawing rectangles
- function draw() {
- var canvas = document.getElementById(‘canvas’);
- if (canvas.getContext) {
- var ctx = canvas.getContext(‘2d’);
- ctx.fillRect(25, 25, 100, 100);
- ctx.clearRect(45, 45, 60, 60);
- ctx.strokeRect(50, 50, 50, 50);} }
Drawing paths
- beginPath()
- closePath()
- stroke()
- fill()
Lines
- lineTo(x, y)
Arcs
- arc(x, y, radius, startAngle, endAngle, anticlockwise)
- arcTo(x1, y1, x2, y2, radius)
Applying styles and colors
Colors
- fillStyle = color
Transparency
- globalAlpha = transparencyValue
Line styles
- lineWidth = value
- lineCap = type
- lineJoin = type
- miterLimit = value
- getLineDash()
- setLineDash(segments)
- lineDashOffset = value
Gradients
- createLinearGradient(x1, y1, x2, y2)
- createRadialGradient(x1, y1, r1, x2, y2, r2)
Patterns
- createPattern(image, type)
Shadows
- shadowOffsetX = float
- shadowBlur = float
- shadowColor = color
Drawing text
- fillText(text, x, y [, maxWidth])
- strokeText(text, x, y [, maxWidth])
Styling text
- font = value
- textAlign = value
- textBaseline = value
- direction = value